Traffic optimization: the road is for everyone
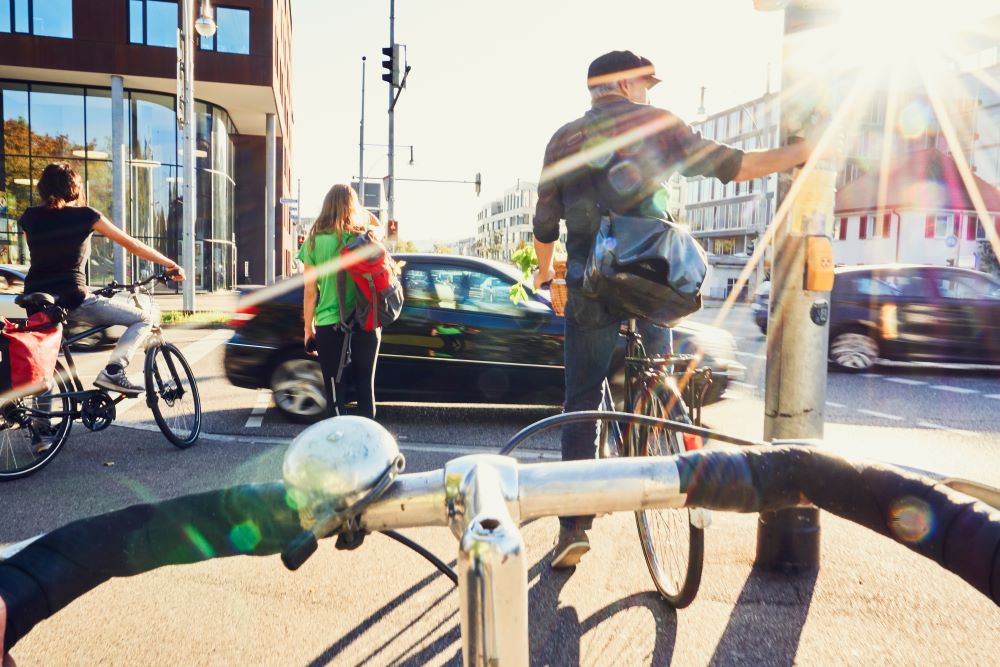
The challenges our society faces are becoming more and more concrete. We need to reduce CO2 and nitrogen emissions. We need to build 900,000 homes in our cities. We need to accommodate vulnerable road users better. And we need to encourage cycling and the use of public transport. And all these challenges are interrelated.
Ideally, we would like to meet these challenges with a data-driven approach. But what kind of data do we have? We are actually quite myopic when it comes to possibilities for improvement in traffic. Pedestrians, cyclists, wheelchair and walker users often don’t feature in measurements, and we are unable to distinguish between freight trucks and delivery vans.
A data-driven approach is a challenge. The underlying principle is that the road is for everyone and that everyone has the right to be seen and to receive information. Everyone deserves a smooth journey and safety.
Vanuit deze visie zijn we aan de slag gegaan in de Verenigde Staten. In San Francisco hadden we drie hoofddoelstellingen voor tien On the basis of this vision, we set to work in the United States. We had three main goals in respect of ten consecutive intersections on 3rd Street in San Francisco:
- Improve public transport and the efficiency of the Light Rail Vehicle (LRV);
- Improve pedestrian crossings, including for large groups;
- Ensure 1 and 2 have minimum impact on the flow of motorized traffic.
The City installed LiDAR sensors at the intersections to detect pedestrians, bipeds, personal vehicles, and freight vehicles. We complemented this information with LRV timetable data, fire department activation data, and data from our own FlowCube sensors (Visual AI) on people waiting on LRV platforms—including detection of wheelchair users. Thus, we created a ‘digital twin’ of the trajectory, which allowed us to realize our goals. LRV waiting time at a red light was reduced by as much as 73%!
The cities of Dublin and Marysville in Ohio were also interested. Dublin assigns a low priority to vehicles. Emergency vehicles have the highest priority, followed by buses, snowplows, bikes, and pedestrians etc. But this does not mean cars should be inconvenienced. We installed FlowCube sensors at the intersections in Dublin to be able to categorize road users, and we are using this data to control the traffic lights. This allows us to stimulate multimodal flows of road users and to optimize traffic flow.
The implementation of the real-time digital twin and the multimodal intersection and trajectory controller in Marysville and Dublin is currently in its final stage. We are analyzing the data collected and the functioning of the traffic light controllers. The responses we have had from these cities are positive: waiting times are going down. In addition, these cities can now more easily prioritize traffic differently, for instance during road works or events.
This data-driven approach allows us to go beyond prioritization and optimization. Together with Goudappel, we are currently researching what can be further improved. For example, we are seeing ‘near misses’ in the data on intersections. These events negatively affect the feeling of safety of vulnerable road users such as parents with children, children, the elderly, and people with a disability. On the basis of this data, we are exploring, together with the City, what further improvements are possible, for example in the layout of intersections.
It pays to take a data-driven approach! But what about the cost? It’s not as expensive as you might think. We replace induction loops by a new sensor; use a central controller to replace signal plans and traffic management; and add a digital twin module. The result: a cost-neutral improvement with a great deal of potential!


